SPARC Manual
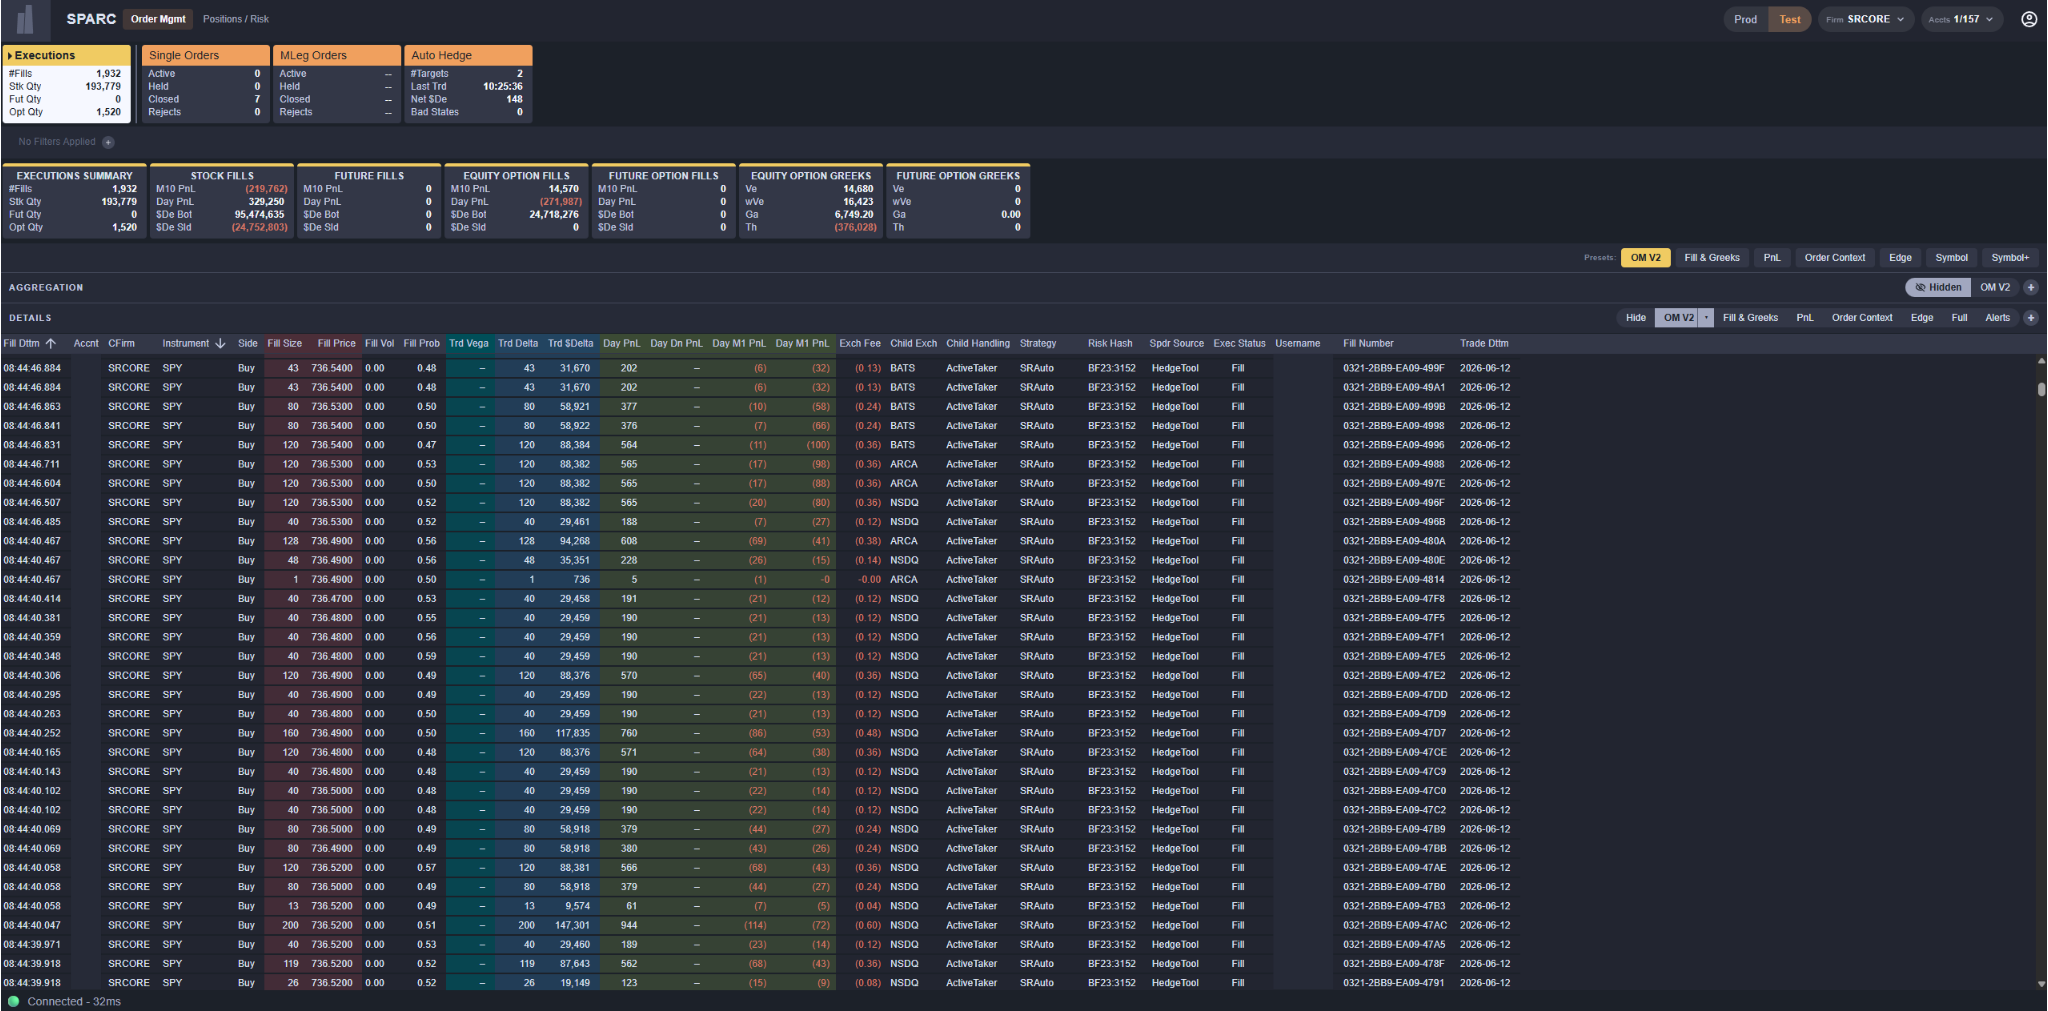
SPARC is SpiderRock Connect's central interface for monitoring and managing the full lifecycle of options trading activity — from order execution and position risk to hedging and auto-responder behavior. Rather than navigating across disconnected tools, traders and risk managers can track live activity, filter down to specific positions or orders, and act on aggregated data all within a single application. The interface is organized into modules, each combining high-level summary totals with progressively granular detail views, so users can move quickly between a broad portfolio snapshot and the individual records driving it.
Download SPARC as a desktop application here:
SPARC Application Components
SPARC is organized into modules covering order management, position and risk monitoring, hedging, and system notices. Each module follows the same three-section anatomy:
- SPARC Tabs (top) – the always-visible header row with one tab per module
- Summary Cards (middle) – filterable rollups specific to the active module
- Aggregations / Details (bottom) – the working surface, with a configurable aggregation pivot and a row-level detail grid
A persistent Chip Filter bar sits between the SPARC Tabs and the Summary Cards. Filters applied there flow downward into the Summary Cards and the Aggregations / Details section, but not upward into the SPARC tabs.
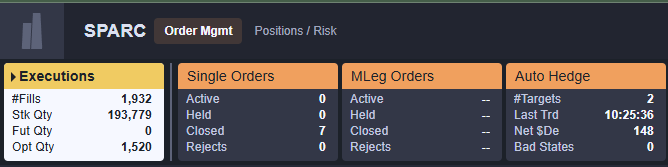
SPARC Tabs
SPARC Tabs are the top-most section. Each tab corresponds to one module; clicking a tab switches the active module. All tabs remain visible regardless of which module is currently loaded. In a future release, users will be able to show or hide tabs per profile.
A SPARC tab consists of the module name, a color indicating the category that module belongs to, and a small set of headline values that summarize the module’s activity at a glance. Values shown on the tab are not affected by chip filters – they always reflect the unfiltered totals for that module.
Module Categories
For the initial release, SPARC presents three categories of module, each with its own color:
| Category | Color | Modules |
|---|---|---|
| Order Management | Orange | Executions, Single Orders, MLeg Orders, Auto Hedge |
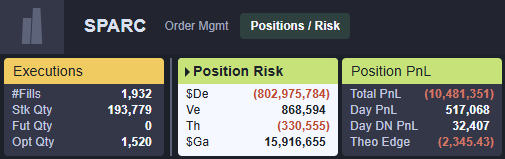
| Positions / Risk | Lime | Positions Risk, Position PnL |
Additional modules – auction responders, allocations, risk controls, equity locates, and configuration – exist in the platform and will be enabled in subsequent releases.
Headline Tab Values
Each module's tab surfaces a small set of high-level metrics:
| Module | Headline Values |
|---|---|
| Executions | #Fills, Stk Qty, Fut Qty, Opt Qty |
| Single Orders | Active, Held, Closed, Rejects |
| MLeg Orders | Active, Held, Closed, Rejects |
| Auto Hedge | #Targets, Bad States, Net $De, Last Trd |
| Position Risk | $De, Ve, Th, $Ga |
| Position PnL | Total PnL, Theo Edge, Day PnL, Day Dn PnL |
Switching Modules
The header presents tabs as group pills – a single-click selects a module; Ctrl/Cmd-click toggles additional groups in or out of view. If any groups have been hidden, A Hidden pill appears at the right edge showing the count.
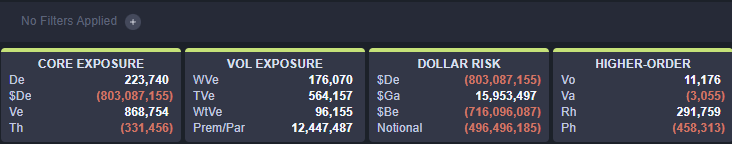
Summary Cards
Below the chip-filter bar are a set of Summary Cards. Each card expands on the headline values from the SPARC tab and groups related metrics under a single topic. For example: In Executions, the cards split fills by Stock, Future, Equity Option, and Future Option.
Unlike the SPARC tabs, Summary Cards respect chip filters. The first card in each module typically mirrors the SPARC tab headline values, so users can immediately see how a filter narrows the dataset. If no filter is applied, that first card and the SPARC tab show the same numbers.
Aggregations / Details
The bottom section of every module is where the bulk of analysis happens. It is split into two stacked panels:
- Aggregation (upper panel) – pivots the module’s data by user-selected dimensions
- Details (lower panel) – shows the underlying row-level records
A vertical splitter between the two panels can be dragged to give either panel more space. Each panel also has its own Hide button in its header, so a user can collapse the aggregation panel and view only the details panel, or vice versa.
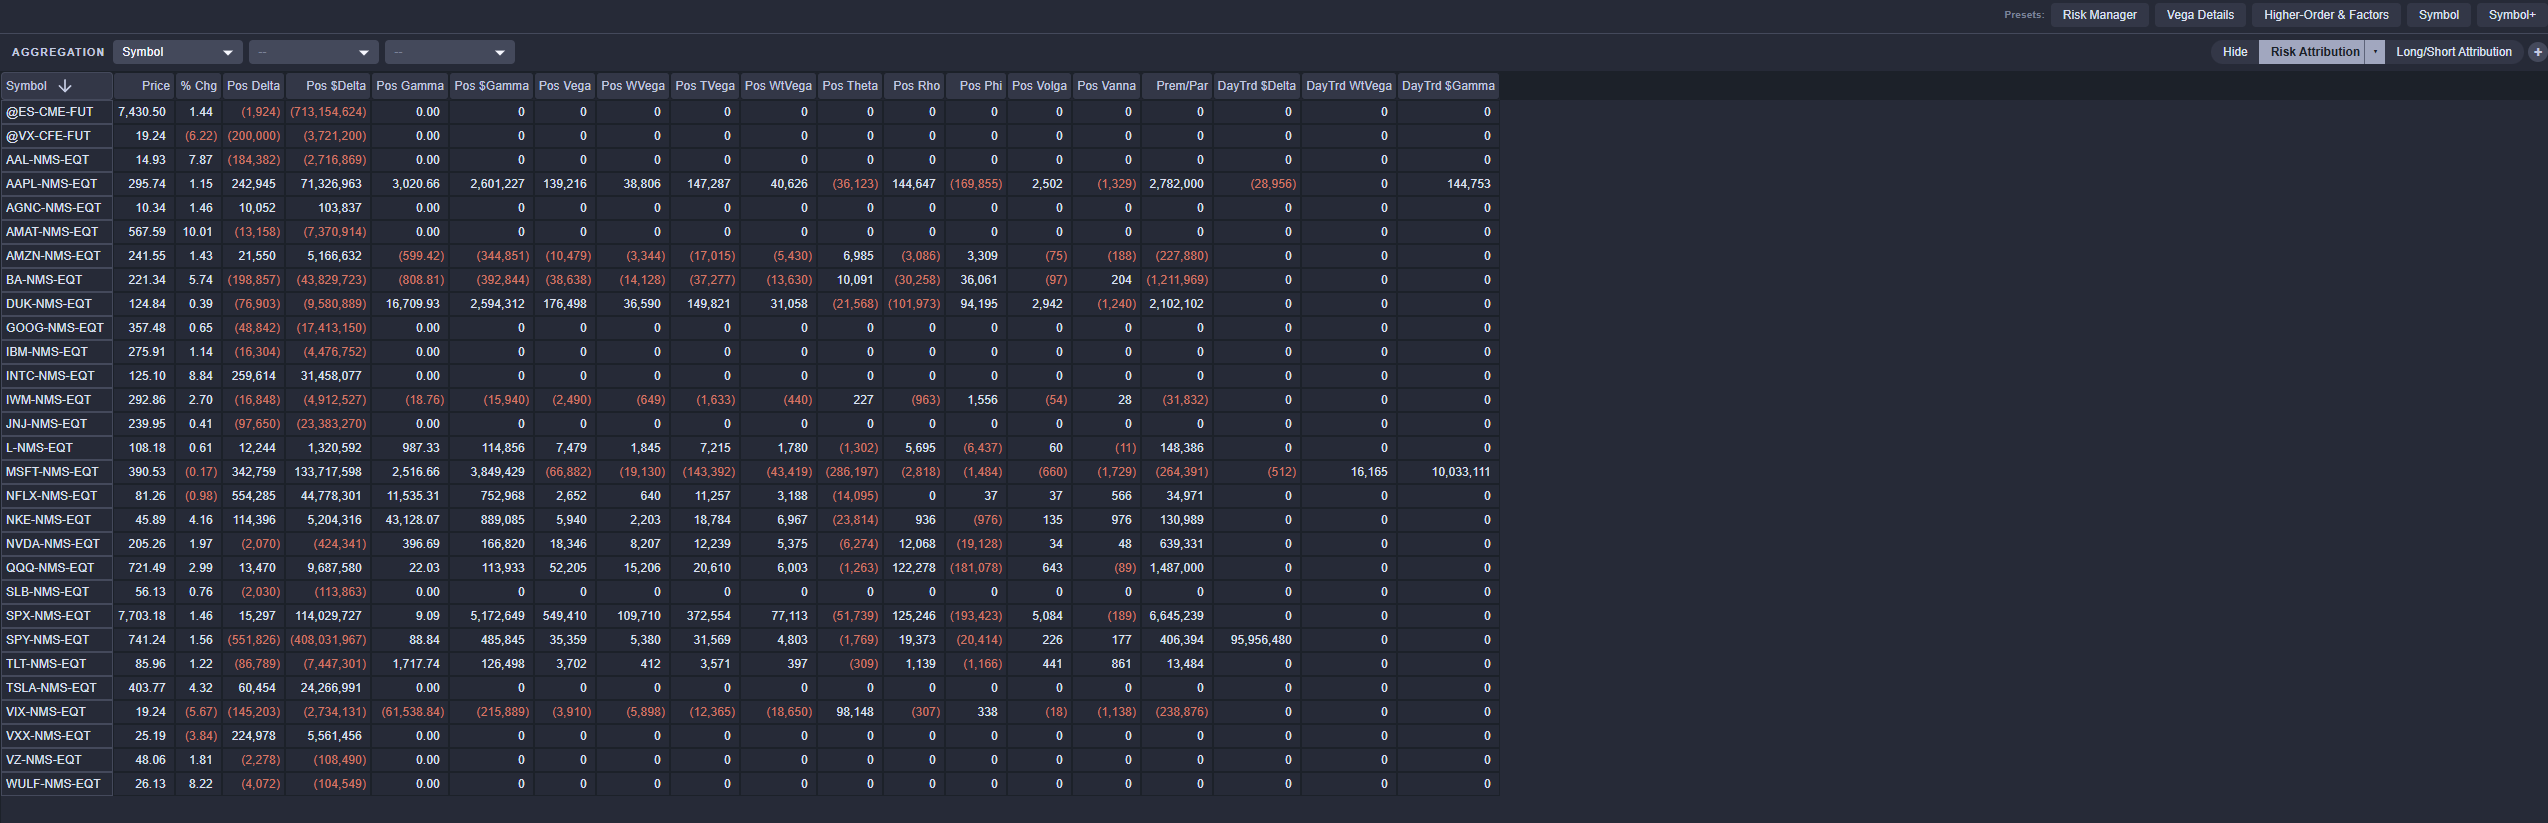
Aggregations
The Aggregations panel pivots the dataset by up to three user-selected keys, chosen from inline dropdowns in the panel header. The first key (left-most column) is required; the second and third are optional. Available keys depend on the module.
The Aggregation panel view in this release is Grid – a spreadsheet-style view with the chosen aggregation keys as the left-most columns. The right-side columns are controlled by the chosen column set. Each module ships with one or more predefined column sets, and users can create their own custom sets via the + button beside the column-set selector. Custom sets can be edited, duplicated, or deleted from the caret menu next to the active set.
Additional Aggregation panel views are under development.
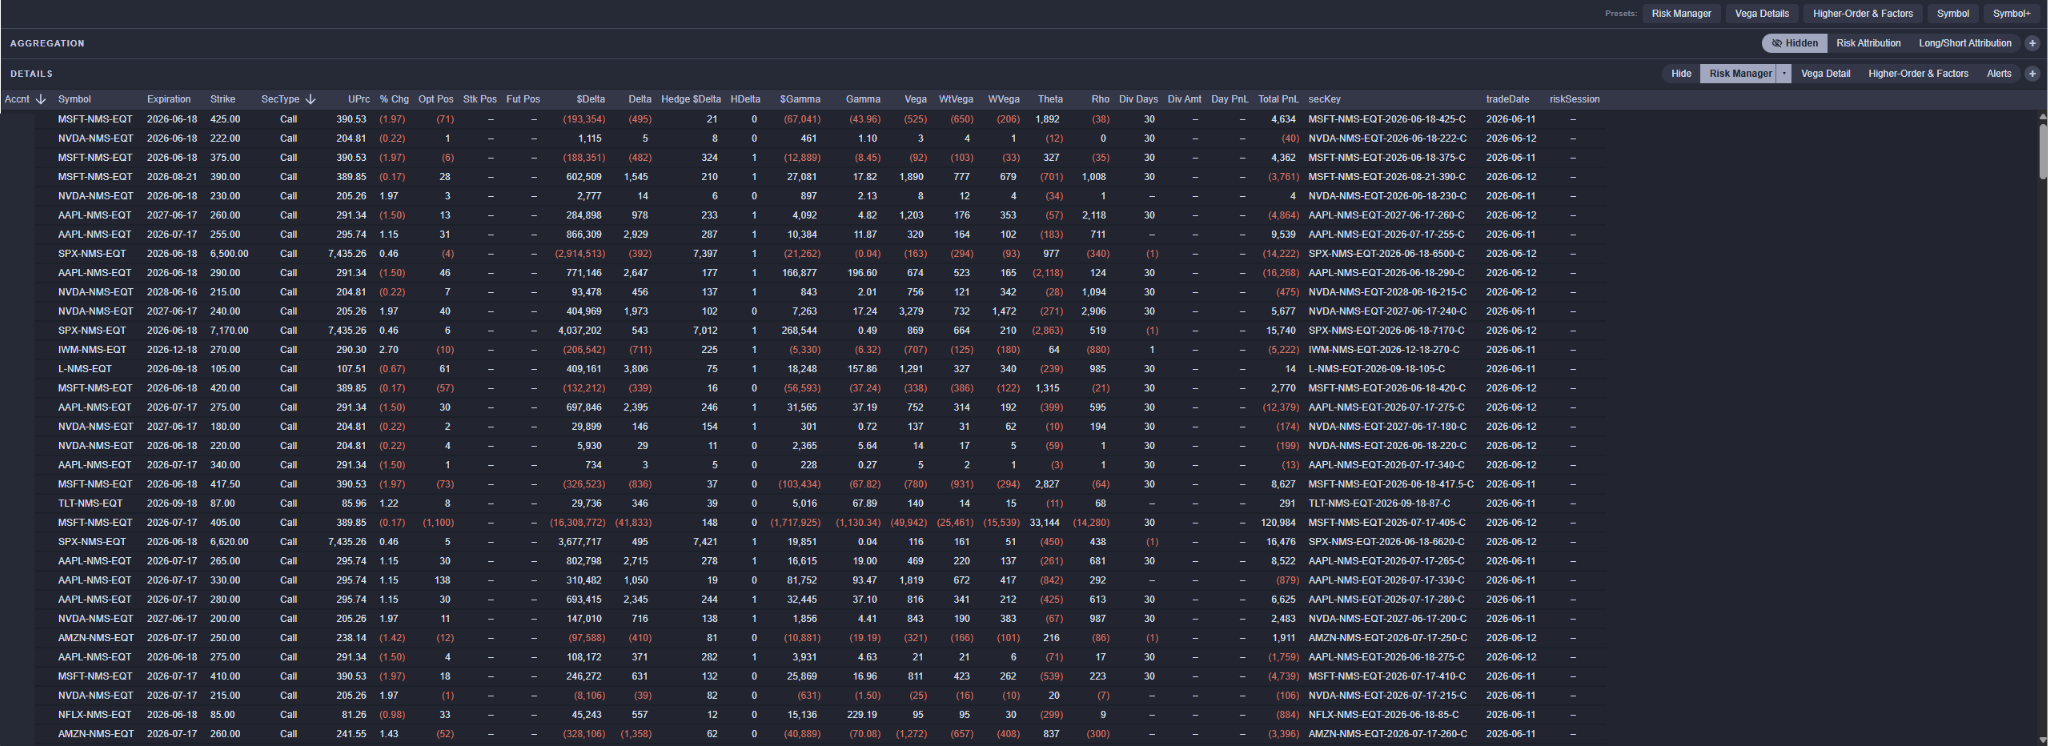
Details
The Details panel shows every individual record contributing to the data shown above in the Aggregations panel, Summary Cards, and SPARC tabs.
Each row represents one underlying message; clicking a row opens a slide drawer from the right with the full set of fields for that record, grouped by taps. Close it with the X in its top-right corner, or step through adjacent rows using the arrows. In future releases, some cells in a slide drawer will be editable.
Detail columns are sortable by clicking the column headers, and – like the Aggregations panel – the column set can be switched via the selector in the panel header. Custom column sets can also be created a la Aggregations panel.
Each module sits on top of one or more SpiderRock backing-store messages. Clients with API access can subscribe to these messages directly to retrieve the same underlying data that SPARC consumes.
| Module | Message |
|---|---|
| Executions | TradeCubeDetailV5 |
| Single Orders | SpdrParentBrkrState |
| MLeg Orders | SpdrMLegBrkrState |
| Auto Hedge | SpdrAutoHedgeState |
| Position Risk | RiskCubeDetailV5 |
| Position PnL | RiskCubeDetailV5 |
| SystemNotices | SpdrAlertRecord |
Global Functionality
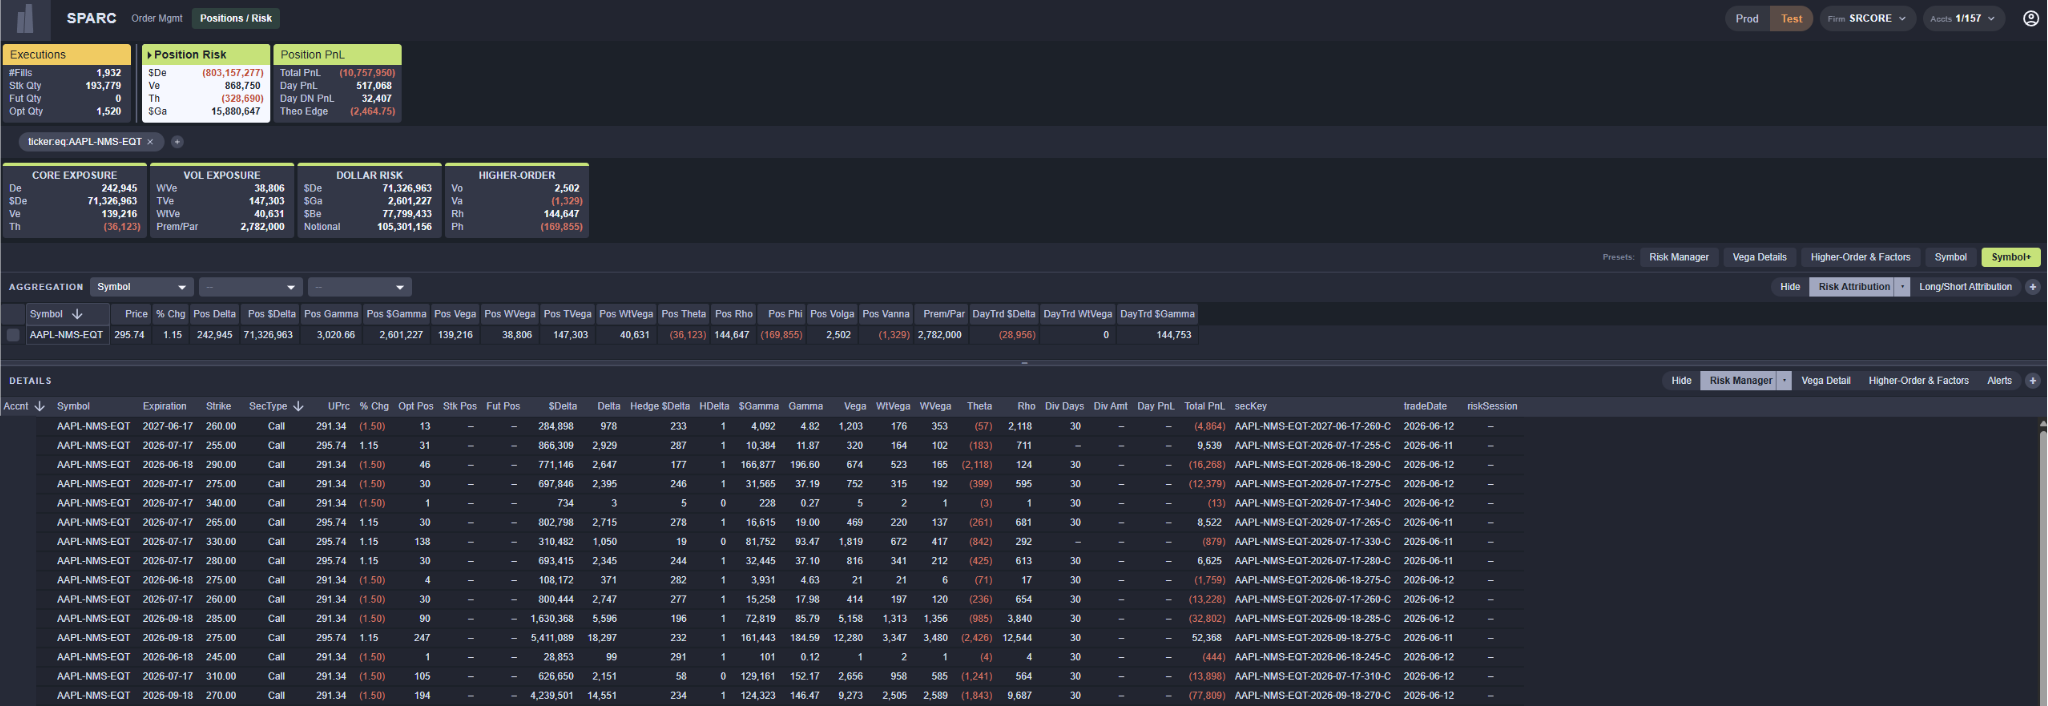
Chip Filters
A user can apply filters to narrow what the Summary Cards and Aggregations / Details show. To create a filter, hover over any aggregated value in a summary card or any cell in the grids – a small + and – spear at the top-right of the value. Click + to include only rows matching that value, or – to exclude them.
Once added, filters appear as chips in the filter bar above the Summary Cards. Each chip displays the field, operator, and value (e.g., ticker:equals:AAPL). Clicking a chip opens an editor where the field, operator (equals, not-equals, contains, etc.), and value can all be changed. To remove a chip, click the X on it.
Filters apply to everything below the filter bar – the Summary Cards and the Aggregations / Details section – but not to the SPARC tabs above.
When no filters are active, the bar shows the placeholder text “No Filters Applied”.
Chip filters persist when a user switches between SPARC modules. If the field from a chip filter is also applicable to the new module, the chip remains active and continues to filter the data on the new tab. If the filed is not applicable to the new module, the chip stays visible in the bar but turns grey to indicate it has no effect on the current view. Switching back to a module where the field is applicable re-activates the chip automatically – there is no need to recreate it.
Presets
Just above the Aggregations / Details section is a Presets row. Presets are saved combinations of column set, aggregation keys, and filters that can be applied with a single click. Selecting a preset highlights it with the module’s accent color. Presets are a quick way to switch between workflows. For example, an Executions user might keep one preset focused on stock fills and another on option Greeks.
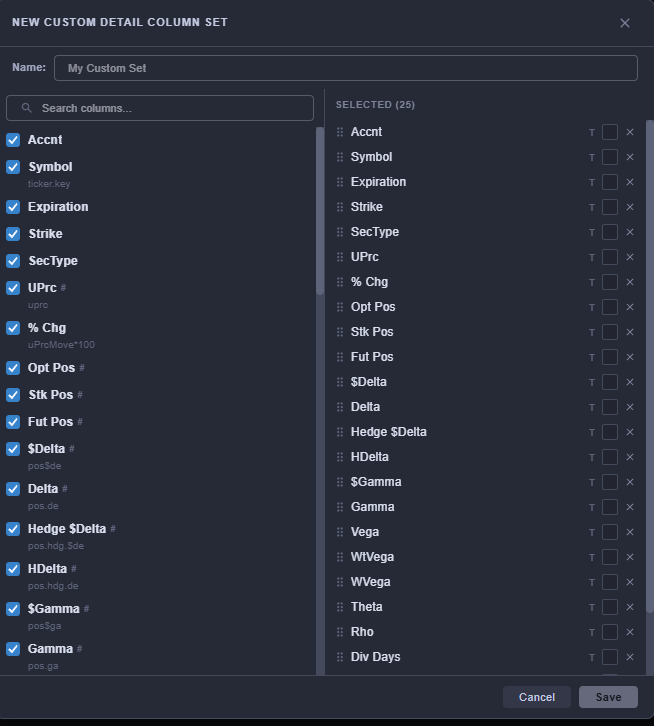
Column Set Customizer
Both the Aggregations and Details panels expose a Column Set selector in their header. The selector lists all built-in column sets for the active module in addition to any custom sets the user has created (custom sets are prefixed with a small dot). The + button next to the selector opens the Customizer, where the visible columns, their order, and their formatting can be edited. The caret menu on the active set offers Edit, Duplicate, and Delete.
A user could also apply colors to different columns via the Customizer to assist in readability and scan-ability.
Slide Drawer
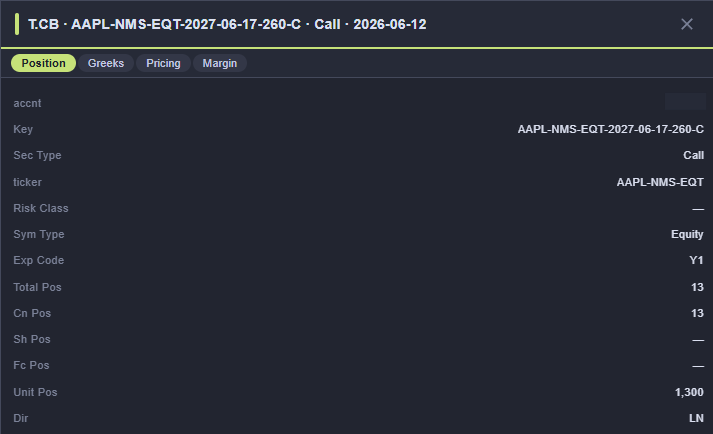
Clicking any row in the Details grid opens a slide drawer from the right side of the screen. The drawer shows the full field set of that record, organized into clickable tabs (one tab per logical group, plus tabs for any nested repeating data). The drawer’s header bar is colored with the module’s accent color. User the < and > arrows in the drawer to step through adjacent selected rows. Close the drawer with the X in its top-right corner.
Section Hide
The Aggregations and Details panels can each be hidden independently using the Hide button in their respective headers. A hidden panel can be restored from the same button (which then shows Hidden with a crossed-eye icon).
System Notices vs. Alerts
SPARC surfaces problem conditions through two distinct mechanism – one global and one scoped to the tab the user is currently looking at.
System Notices is a dedicated module (second left-most tab, grey). It carries system-wide notifications pushed by SpiderRock to the client. These notifications will detail platform-level events such as connectivity changes, throttles, supervisory advisories, and other notices that are not tied to any one order or position. Because it is its own module, System Notices is visible from anywhere in SPARC by clicking its tab, and its headline values always reflect the unfiltered platform totals. This module is under active development.
Alerts is a preset available inside other modules and is accessed from the Presets row above the Aggregations / Details section. Selecting the Alerts preset reconfigures the active module to surface only the problem rows relevant to that module’s content. If there is a new Alert, there will be a red dot that appears on the top-right corner of a tab that will only disappear after the user clicks on the Alert preset.
- For example, in Single Orders and MLeg Orders, the Alerts preset will cover rejected, held, and otherwise problematic orders with troubleshooting columns (Order Dttm, Accnt, Status fields) brought to the front.