Portal App Manual
The Portal App is an application in the SpiderRock Connect platform that allows users to view and manage certain messages within our system. Similar to how users use SRSE or MLink APIs, users can view messages they have scope for and if they have the correct permissions, also edit them as needed. Unlike SRSE or MLink, the Portal is a provided front end that can be accessed via a web browser or desktop application. The messages within this tool are scoped by user and by client firm so sensitive data can only be accessed through strict controls. This tool replaces the Admin Viewer and Control Viewer in Citrix tools for Platform V7.
Accessing the Portal
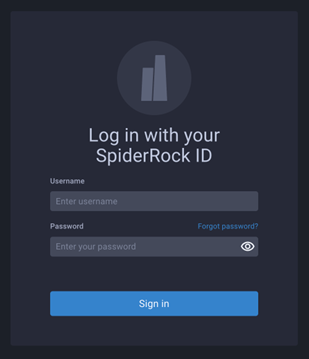
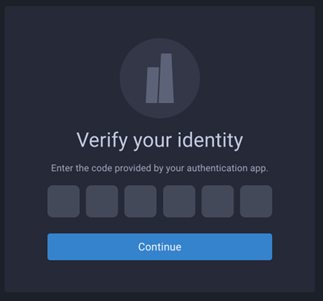
Users can either log into the Portal through the web at https://www.spiderrockconnect.com/portal or an installed desktop application. Users can gain access to the Portal after a SpiderRock Support Admin or Sponsor Firm Admin creates credentials for them or grants access to and existing user. Like the entire SpiderRock Connect system, multi-factor authentication is required for login.
Viewing Messages
Users can view messages by navigating to them in the upper-right hand corner and can view them by SRSE category or MLink token (MLink token is default). Once a grouping has been chosen, the user can either filter further by grouping or search all of them (All is default).

Finally, once the individual message type is found, the user clicks on it and all messages of that message type will be loaded in the below Results Grid.
By default, a subset of fields (or columns) in the grid are shown, to see every field users can optionally enable the “Show All Columns” toggle. Note showing all columns decreases performance and speed as more bandwidth is needed to deliver the full dataset to the screen.
From there, a user may select an individual message that will then load all of the fields for that record in the Details Panel to the right.
Editing Messages
If the user has access to be able to edit a particular message type, the fields will be shown as editable in the Details Panel.
If a user edits a field, the field will be shown with a blue outline to indicate the field has been changed and will update upon saving the changes. Once the record is saved, the field will show its' editable status.
To save changes, users should click the ‘Save Changes’ button in the Details Panel.
Filtering
Due to the same results limits found in MLink, the Portal will only return up to 500 results to the Results Grid. In order to return a refined result set that a user may be trying to specifically find, users are expected to use our advanced filtering system to target their expected results. There are several ways to add filters listed below.
Query Panel
At the top of the application, the Query Panel shows commonly used fields to filter on per message type. A user can either enter strings or select enums they can then apply to the filter system. Once applied, these filters show in the below chip system where they can be edited or removed.
Chip Filters
If a user wants to add a filter for a field not visible, the user can click the “+”button in the chip filter section to select any field in the record, an operator and enter a filter value. If a non-visible field is added as a filter, it will then appear in the Results Grid. Chip filters can be edited by clicking on the chip or removed by clicking the “x” on the chip.
Complex filters can be made by changing the AND/OR operator when more than one filter is added.
Quick Filters
If a user wants to add a quick filter, simply hover over a cell in the Results Grid to reveal a “+/-”control on the right side of the cell. By clicking the “+”, a user will add a filter equaling the value of the field of the selected cell (additive). By clicking the �“-”, a user will add a filter not equal to the value of the field of the selected cell (reductive).
Time Filters
On the upper-right side of the application, there is a time control where a user can either choose a value from the dropdown control or click through the histogram to navigate through time. Clicking into the histogram will zoom into the time period of that bar and divide time further.
Using the dropdown, a user can click the calendar icon to select pre-defined time ranges or if you click on the left side you can enter a specific date-time range.
Summarizing
If a user would like to see summaries of a message type in aggregate, they can choose to add a Summary Grid by clicking the plus button in the Summarize Bar and adding a field to summarize and aggregate by. The Portal allows for up to 3 fields to aggregate by, but will summarize the content for every field in the message type for as many records that exist to the scope of the user’s settings. This gives the user an ability to view data in its entirety rather than being limited to the only being able to view 500 records at a time.
Comparison
If a user would like to compare two or more records together, they can select multiple records by holding Shift or Ctrl (Cmd if on Mac) and clicking a new record. Once multiple records have been selected a Compare button will appear at the bottom of the Results Grid. If clicked, a new Comparison Grid will appear that will show all fields of the selected records so a user can scroll across and look for differences. If the content is not different from each other, the content is presented in gray text, if the content differs from each other, the content will be displayed in white so that the values can be more easily compared.
To exit Comparison Mode, the clear selection button may be pressed and the user will be returned to the Results Grid with nothing selected.
Importing / Exporting Data
In order to add a new record to a message type, a user can click the “+” button to reveal a dropdown. From here a user can add a new single record which will open up a Details Panel with an empty form for the user to enter information. Upon clicking the “Create Record” button the new record will have been saved.
Alternatively, a user can import several records from a CSV file that’s properly formatted by choosing “Import from file”. After being selected a user can browse for a file to upload. From there, the Portal will check the format to ensure it matches the schema of the message type it’s being imported into and present any errors to the user. After ensuring the format aligns, the user can import the entire file and will add new records as determined by the CSV file.
In order to export data, find the menu icon in the bottom left of any grid. Opening the menu, the user will see various options for how to export and download the data.
Advanced Features
The Portal supports a few advanced features for users in more unique situations.
Changing Servers
In some cases, running the Portal on a network that doesn’t have access to the internet requires users to change the source of the backend servers. In this case, users should expect to get any special IP address or URL from their network administrators. Once obtained, the user can change the server by opening the user menu in the upper right corner of the application and using the dropdown of the “Backend Server” option.
Viewing Debug Window
Occasionally, a user may want to access the Portal’s Debug Window if asked by our Support team. This window contains helpful information to our team to understand why a user may be experiencing something unexpected. To open this window, simply press Shift+Ctrl+;