Transaction Cost Analysis Metrics
Why does TCA matter?
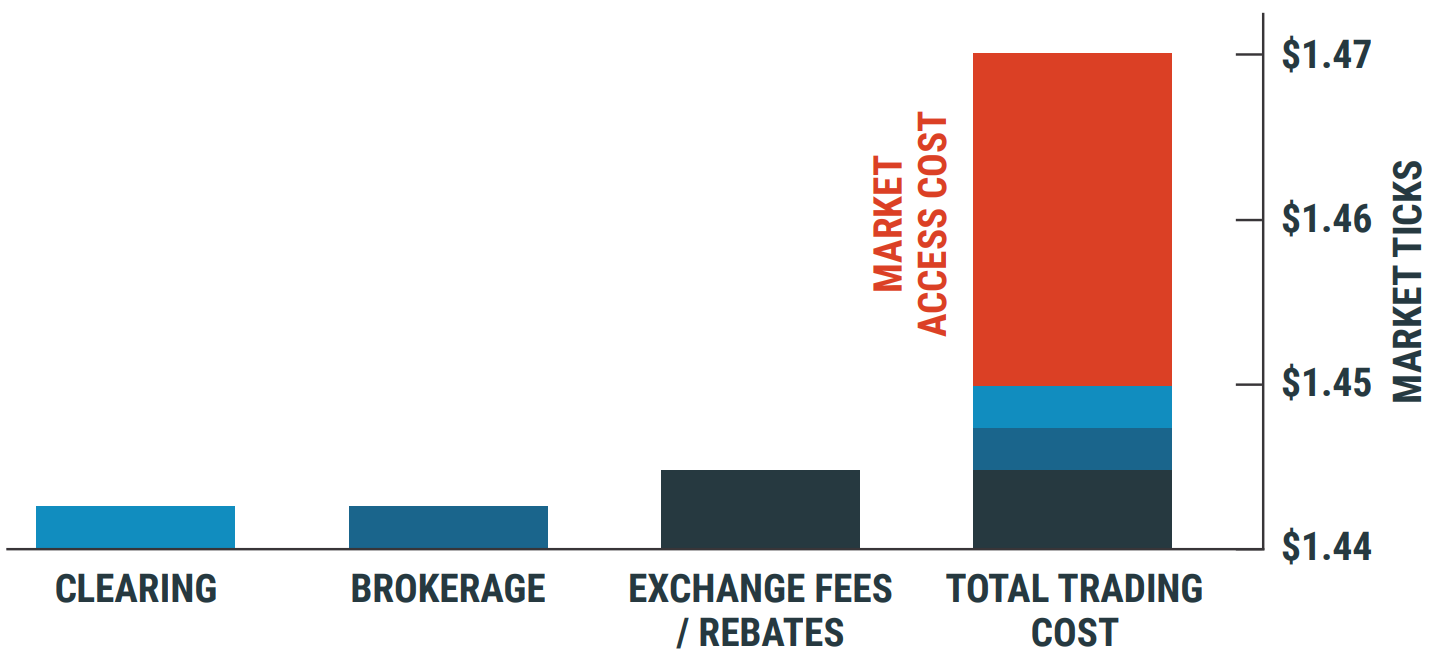
Market access cost (reflected in the NBBO spread) is the most significant cost of trading, and it varies based on market width and available liquidity. Clearing, brokerage, and exchange fees, by contrast, are relatively fixed and small: exchange fees in the listed equity options market typically run ±$0.25 to $0.50 per contract. Yet total market access cost, when factoring in market maker profitability, can exceed $3.00 per contract on unoptimized executions. This gap underscores why Transaction Cost Analysis (TCA) is essential: it provides the means to quantify the total cost and quality of order executions.
TCA for Derivatives: The Core Challenge
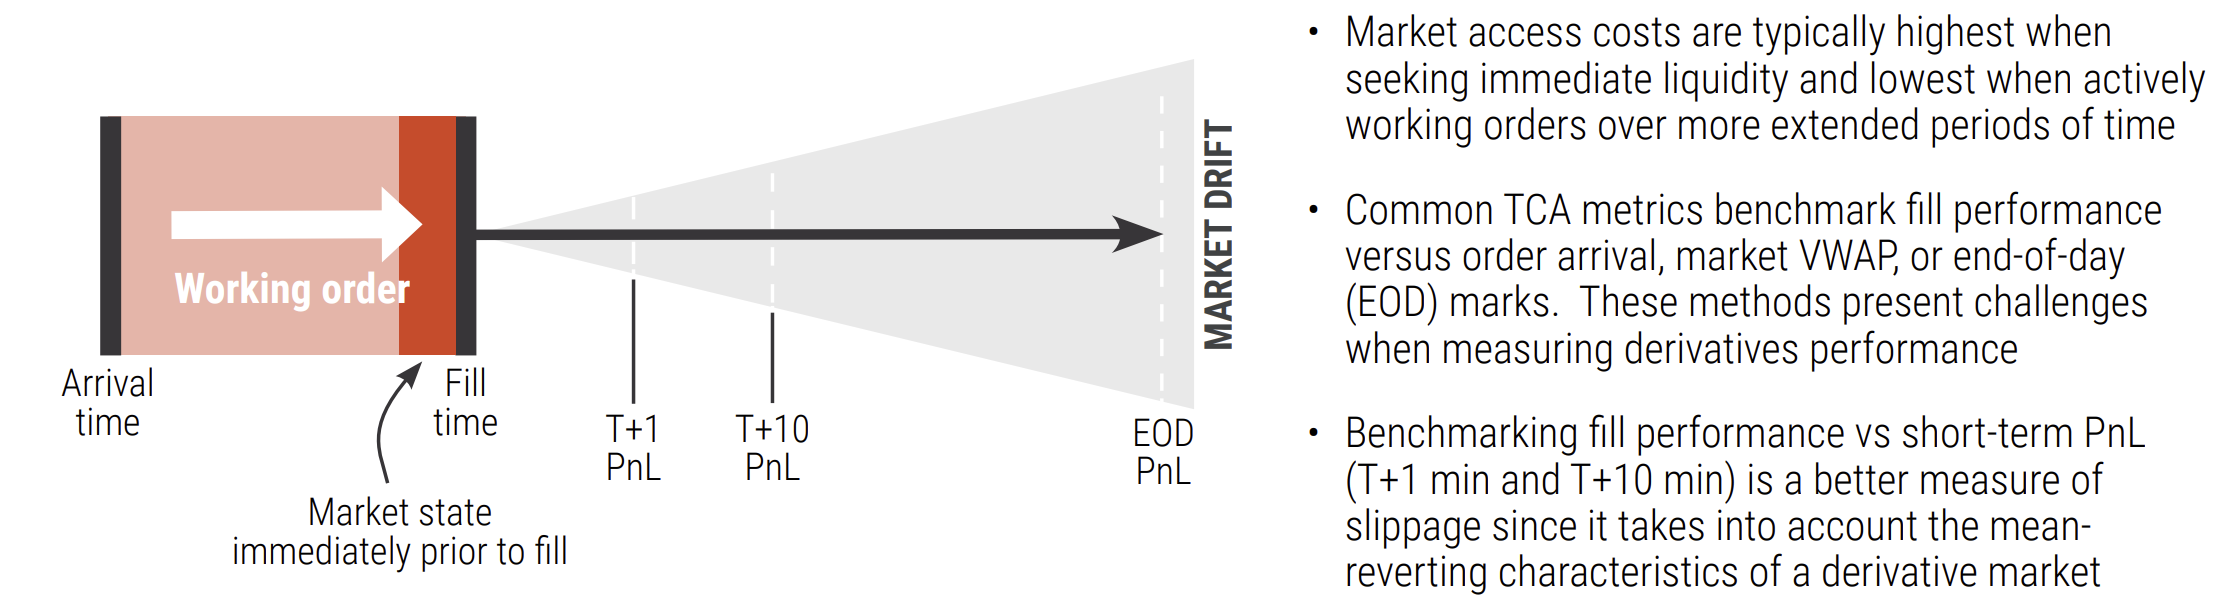
Because underlying asset prices move faster than derivative prices, the timing of a derivative execution relative to underlying price movement is the primary driver of execution quality. Equity-style price improvement measured at the time of execution or at order arrival does not capture this dynamic, making it an insufficient standalone metric to measure TCA for derivatives.
In the options market, the cost of crossing the market is equivalent to paying the market maker half the bid/ask spread, and clients who trade without regard to spread dynamics will typically pay the full half-spread cost. Bid/ask spreads are mean-reverting: they widen and contract around an average width. The key to reducing market access cost, then, lies in taking advantage of these contractions. We have modeled these mean-reverting dynamics to a 10-minute post-execution timeframe, which is why we measure execution performance on a 10-minute forward delta-neutral PnL basis rather than by point-in-time price improvement.
Pre-TCA Benchmark
We construct a performance benchmark by modeling the likely profitability of the market maker on each trade. This is done by archiving every print in the marketplace, identifying with precision whether it was executed on the bid or offer, and applying assumptions across a range of trade-characterizing variables—including high/low delta, volatility, volume, stock price, and penny vs. non-penny stocks. The result is a benchmark spanning all listed options: what a customer pays the market is the mirror image of market maker profitability.
The model rests on two core assumptions:
- The counterparty hedges their side of each trade in the underlying market immediately upon execution, at mid-market, at any size, with no transaction fees.
- The counterparty exits both the option and stock positions at mid-market 10 minutes after the trade.
Under these assumptions, the counterparty's realized PnL on each trade can be calculated precisely, and the originator's true cost of accessing market liquidity is its inverse.
Improving on the Benchmark
Clients can outperform the pre-TCA benchmark by using the SpiderRock algorithmic execution strategies that are specifically calibrated on alpha probabilities. These probabilities are real-time numerical estimates of expected short-term profitability for active market bid and offer price points. In other words, our algorithmic engines continuously score each market tick for the probability of a positive 10-minute delta-neutral PnL outcome.
There are two different style that can leverage the SpiderRock alpha probabilities:
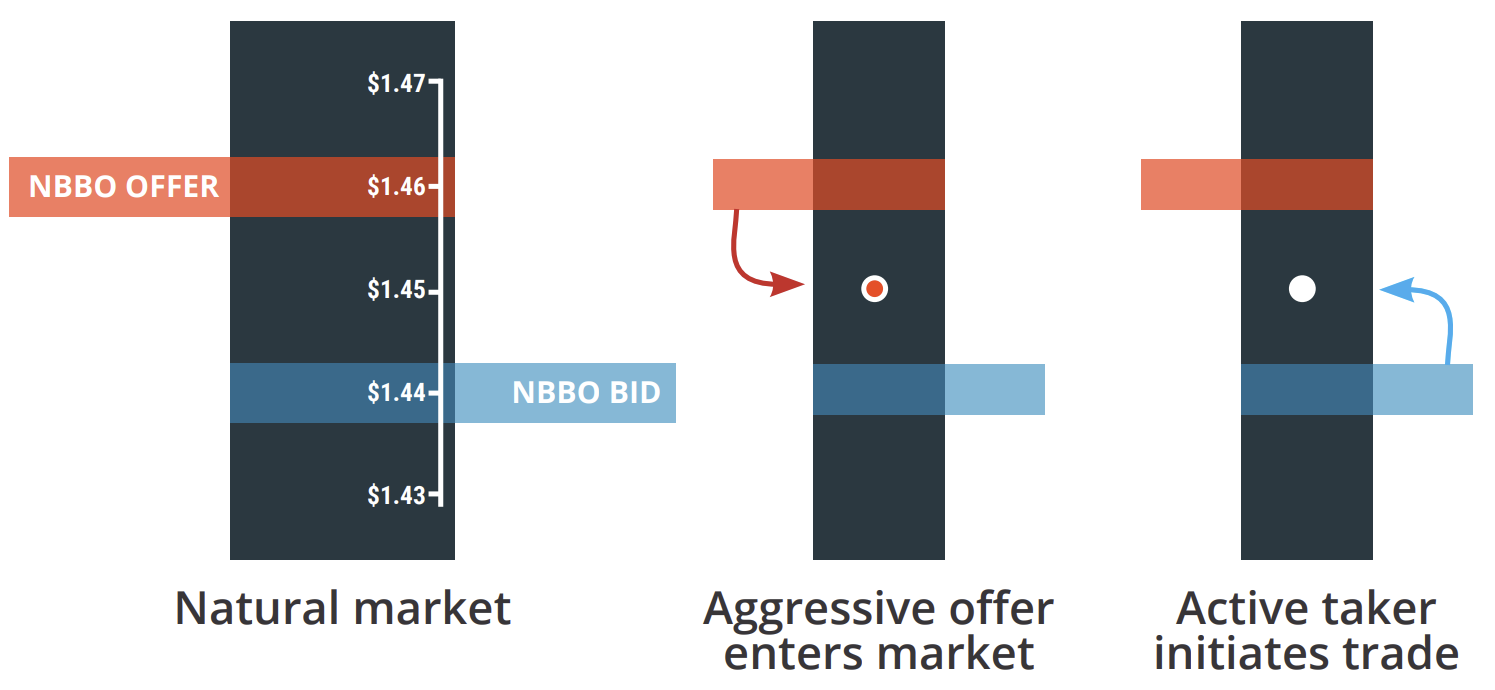
- Active TAKER: Designed to trigger an order to cross the market on price opportunities that score at or above a defined probability threshold. Active taking logic attempts to detect orders with aggressive prices in the marketplace and trade with them as often as possible.
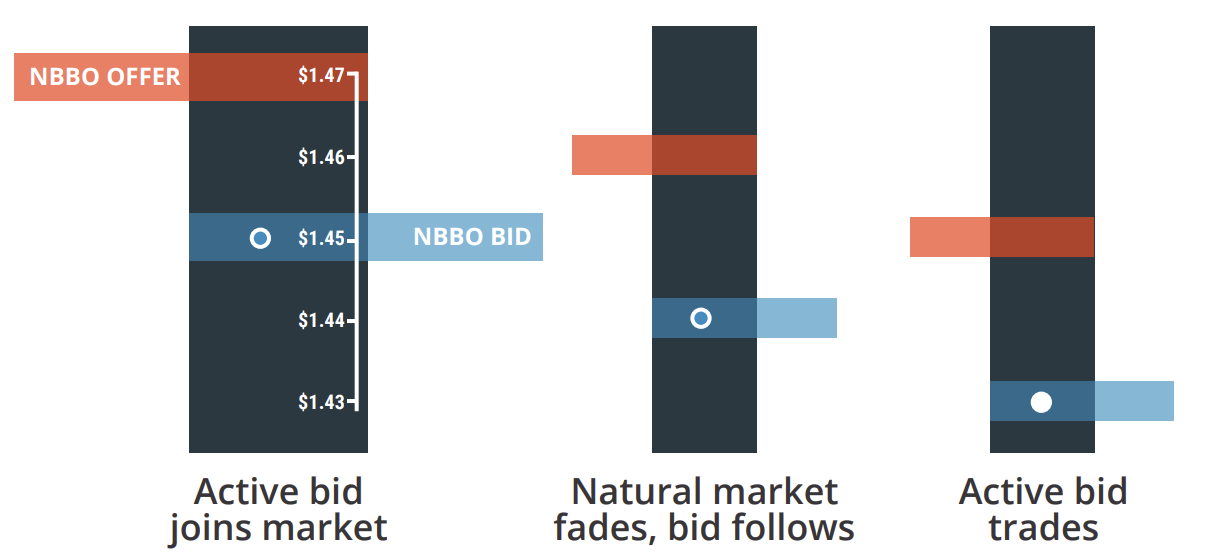
Example of an Active Taking Order
- Active MAKER: Dynamic posting strategies referencing an alpha probability or an offset from the SpiderRock volatility surfaces as a secondary limit. These active maker algos can enhance fill quality and mitigate exchange fees by capturing maker rebates.
Examples of Passive Making versus Active Making Logic
| Passive making order yielding poor TCA metrics | Active making order yielding good TCA metrics |
|---|---|
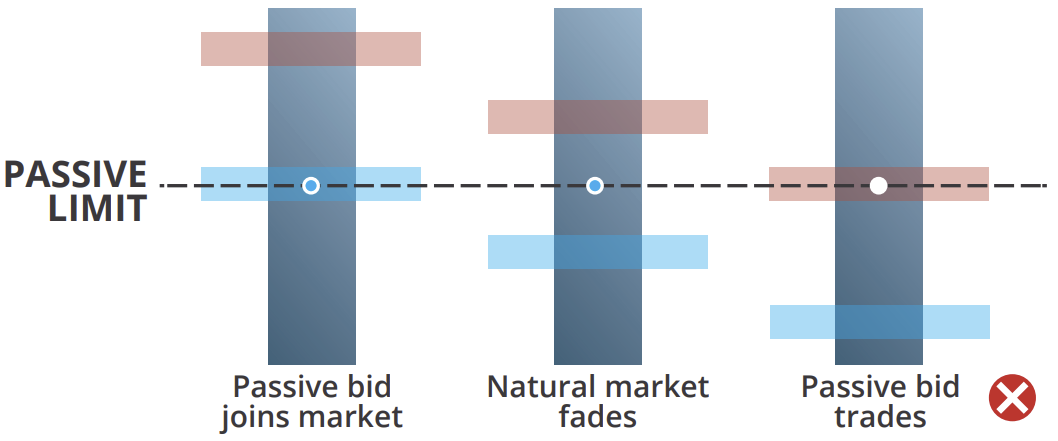 |  |

Key TCA Metrics
A good indication of TCA performance is the comparison of short-term PnL plus exchange fees/rebates against the half-width cost. This can be done across all trading activity via SpiderRock with some degree of granularity by algo type and by liquidity bucket. The algorithmic techniques described above can help clients access the market at near-zero cost.
- The benchmark (half-width cost) — Cost of crossing the market which also represents the market maker's expected profitability (formula in tables below)
- Short-term delta-neutral PnL (10-minute forward) — Fill price vs. Surface price at T + 10min (delta neutral)
- Exchange fees and rebates — What a client pays an exchange to access the screen market. Typically, an exchange will charge a fee when removing liquidity, and will give a rebate when making liquidity (only on maker/taker exchanges).
TCA Metrics Glossary
Parent Order Summary
| Variable/Measure | Definition |
|---|---|
| FIX | Orders sent via FIX |
| SRSE | Orders sent via SRSE |
| GUI Tools | Orders sent via the GUI |
| Other | Orders sent via OM, Legger orders, MLegResponse, Auction Strategy orders, etc. |
Child Order Summary
| Variable/Measure | Definition |
|---|---|
| Child Orders | Average number of child orders sent per day |
| Avg. Child Order Size | Average contract size of child orders sent to exchanges |
| Filled Contracts | Average number of filled contracts per day |
| Contract Fill (%) | Average daily fill rate (filled contracts / total number of contracts sent) |
| Order Fill (%) | Average daily fill rate (filled orders / number of orders sent) |
| Price Improve / Cn | Fill price vs. Bid or Ask price If Buy: Ask price - Fill price If Sell: Fill price - Bid price |
| Near-Touch PnL | Fill price vs. Fill Bid or Ask price If Buy: Fill Ask Prc - Fill Price If Sell: Fill Price - Fill Bid Price |
| Far-Touch PnL | Fill price vs. Arrival (Parent) Bid or Ask price If Buy: Arrival Ask Prc - Fill Price If Sell: Fill Price - Arrival Bid Price |
| Surf Edge / Cn | Fill price vs. Surface price If Buy: Surface price - Fill price If Sell: Fill price - Surface price |
| Avg. Fill Prob | Average fill probability per contract |
| Short-Term Dn PnL / Cn | Fill price vs. Surface price T + 10min (delta neutral) |
| Day Dn PnL / Cn | Fill price vs. SpiderRock closing mark (delta neutral; delta at time of fill) |
| Arrival Dn PnL / Cn | Fill price vs. Parent order arrival time mid-mark (delta neutral) |
| 1/2-Width Cost / Cn | (Ask price - Bid Price) / 2 |
| Exchange fees / Cn | Average exchange fees associated with fills (Negative = fee; Positive = rebate) |
Quote Benchmark PnL Summary
| Variable/Measure | Definition |
|---|---|
| High Liquidity | Less than $0.05 spread - relative to $100 underlier Example: A $300 name will end up in this bucket if spread is less than $0.15 |
| Mid Liquidity | Less than $0.25 spread - relative to $100 underlier |
| Low Liquidity | $0.25 and above - relative to $100 underlier |
| <5 sec | Average order working time of 5 seconds |
| <5 min | Average order working time of 5 minutes |
| > 5 mins | Average order working time of more than 5 minutes |
| Qwap PnL | Fill price vs. average quoted market (mid-mark) over the life of an order |
| Qwap Dn PnL | Fill price vs. average quoted market (mid-mark) over the life of an order (delta neutral) |
| uDrift Qwap PnL | Underlying price drift over the life of an order |
| Qwap Fill Cns | Average daily number of filled contracts considered for the Qwap analysis |
| With Time (%) | |
| Alone Time (%) |
Active Maker Details
| Variable/Measure | Definition |
|---|---|
| High Liquidity | Less than $0.05 spread - relative to $100 underlier Example: A $300 name will end up in this bucket if spread is less than $0.15 |
| Mid Liquidity | Less than $0.25 spread - relative to $100 underlier |
| Low Liquidity | $0.25 and above - relative to $100 underlier |
| Symbols | Represents the three most active (by contract) |
| Avg. Market Width | Average market width (not relative) |
| Num. of Child Orders | Number of active maker child orders sent to exchanges |
| Num. of BBO Joining Orders | Number of child orders joining the current BBO at send time |
| Num. of BBO Improving Orders | Number of child orders improving exchange BBO at send time |
| Num. of NBBO Joining Orders | Number of child orders joining the current NBBO at send time |
| Num. of NBBO Improving Orders | Number of child orders improving the current NBBO at send time |
| Avg. Child Order Size | Average contract size of child orders sent to exchanges |
| Avg. Child Duration(s) | Average lifespan of child orders in seconds |
| Num. of Child Fills | Number of child orders that resulted in a fill or partial fill |
| Filled Contracts | Average number of filled contracts per day |
| Filled Abs Vega | Total absolute filled Vega (100 multiplier applies) |
| Filled Abs Wt Vega | Total absolute filled Vega normalized by volatility and time-to-expiration Cn × iVol × (0.25/years) |
| Half-Width Cost / Cn | (AskPrice - BidPrice) / 2 |
| Short-Term Dn PnL / Cn | Fill price vs. Surface price T + 10min (delta neutral) |
| Day Dn PnL / Cn | Fill price vs. SpiderRock closing mark (delta neutral; delta at time of fill) |
| Arrival Dn PnL / Cn | Fill price vs. Parent order arrival time mid-mark (delta neutral) |
| Cross Impr / Cn | Price improvement weighted by fill size If Buy: Order Ask - Fill Price If Sell: Fill Price - Order Bid Expressed in dollar terms |
| Cross Impr (%) | Percentage-based price improvement relative to the spread Calculated as total price improvement / potential improvement (Order Ask - Order Bid) |
| Surf Edge / Cn | Fill price vs. Surface price If Buy: Surface price - Fill price If Sell: Fill price - Surface price |
| Avg. Fill Prob | Average fill probability per contract |
| Exchange fees / Cn | Average exchange fees associated with fills (Negative = fee; Positive = rebate) |
| Num. (+) Limit Variations | Number of orders where child order fills were better than the limit price (computed at fill time) |
| (+) Slippage Contracts | Total number of contracts filled better than the limit price (computed at fill time) |
| (+) Limit Slippage / Cn | Average positive edge per contract when filled better than the limit price (computed at fill time) |
| Num. (-) Limit Variations | Number of orders where child order fills were worse than the limit price (computed at fill time) |
| (-) Slippage Contracts | Total number of contracts filled worse than the limit price (computed at fill time) |
| (-) Limit Slippage / Cn | Average negative edge per contract when filled worse than the limit price (computed at fill time) |
| Num. of Low Priority Cxl | Any cancel not associated with an underlier change or a risk threshold violation |
| Num. of High Priority Cxl | Cancels associated with an underlier quote change or a risk threshold violation |
| Num. of Fast Cancels | Underlier print contingent cancels Takes place on street side gateways Lowest latency pathway |
| Num. Fills After Cancel | Number of orders filled after a cancel is attempted |
| Fill/Cancel Slippage / Cn | Average $ slippage per contract after a cancel is attempted |
| Num. Cxl Attempted Contracts | Number of contracts filled after a cancel is attempted |
| Low Priority Cxl Latency (ms) | Average latency of low priority cancel in milliseconds |
| High Priority Cxl Latency (ms) | Average latency of a high priority cancel in milliseconds |
Active Taker Details
| Variable/Measure | Definition |
|---|---|
| High Liquidity | Less than $0.05 spread - relative to $100 underlier Example: A $300 name will end up in this bucket if spread is less than $0.15 |
| Mid Liquidity | Less than $0.25 spread - relative to $100 underlier |
| Low Liquidity | $0.25 and above - relative to $100 underlier |
| Symbols | Represent the three most active (by contract) |
| Avg. Market Width | Average market width (not relative) |
| Num. of Child Orders | Number of active taker child orders sent to exchanges |
| Avg. Child Order Size | Average contract size of child orders sent to exchanges |
| Num. of Child Fills | Number of child orders that resulted in a fill or partial fill |
| Filled Contracts | Average number of filled contracts per day |
| Contract Fill % | Average daily fill rate Filled contracts / contracts sent |
| Order Fill % | Average daily fill rate Filled orders / orders sent |
| Filled Abs Vega | Total absolute filled Vega (100 multiplier applies) |
| Filled Abs Wt Vega | Total absolute filled Vega normalized by volatility and time-to-expiration Cn × iVol × (0.25/years) |
| Half-Width Cost / Cn | (AskPrice - BidPrice) / 2 |
| Short-Term Dn PnL / Cn | Fill price vs. Surface price T + 10min (delta neutral) |
| Day Dn PnL / Cn | Fill price vs. SpiderRock closing mark (delta neutral; delta at time of fill) |
| Arrival Dn PnL / Cn | Fill price vs. Parent order arrival time mid-mark (delta neutral) |
| Surf Edge / Cn | Fill price vs. Surface price If Buy: Surface price - Fill price If Sell: Fill price - Surface price |
| Avg. Fill Prob | Average fill probability per contract |
| Exchange fees / Cn | Average exchange fees associated with fills (Negative = fee; Positive = rebate) |
Sweeper Details
| Variable/Measure | Definition |
|---|---|
| Single-Line | One strike per order |
| Multi-Line | Anything greater than one strike per order |
| Avg. NBBO Size | Average NBBO size at time of order |
| Num. of Child Orders | Number of child orders sent to exchanges |
| Avg. Child Order Size | Average contract size of child orders sent to exchanges |
| Num. of Child Order Fills | Number of child orders that resulted in a fill or partial fill |
| Filled Contracts | Average number of filled contracts per day |
| Contract Fill % | Average daily fill rate Filled contracts / contracts sent |
| Order Fill % | Average daily fill rate Filled orders / orders sent |
Spread Details
| Variable/Measure | Definition |
|---|---|
| COBs | Performance metrics associated to Spread orders sent to the Complex Order Books |
| Marketable Leggers | Spread orders that will interact with the Central Limit Order books and are marketable at time of submission |
| Non-Marketable Leggers | Spread orders that will interact with the Central Limit Order books and are non-marketable at time of submisison |
| Avg. Market Width | Average market width (not relative) |
| Num. of Child Orders | Number of child orders sent to exchanges |
| Avg. Child Order Size | Average contract size of child orders sent to exchanges |
| Num. of Child Fills | Number of child orders that resulted in a fill or partial fill |
| Filled Contracts | Average number of filled contracts per day |
| Contract Fill % | Average daily fill rate Filled contracts / contracts sent |
| Filled Abs Vega | Total absolute filled Vega (100 multiplier applies) |
| Filled Abs Wt Vega | Total absolute filled Vega normalized by volatility and time-to-expiration Cn × iVol × (0.25/years) |
| Surf Edge / Cn | Fill price vs. Surface price If Buy: Surface price - Fill price If Sell: Fill price - Surface price |
| Avg. Fill Prob | Average fill probability per contract |
| Short-Term Dn PnL / Cn | Fill price vs. Surface price T + 10min (delta neutral) |
| Day Dn PnL / Cn | Fill price vs. SpiderRock closing mark (delta neutral; delta at time of fill) |
| Arrival Dn PnL / Cn | Fill price vs. Parent order arrival time mid-mark (delta neutral) |
| Half-Width Cost / Cn | (AskPrice - BidPrice) / 2 |
| Exchange fees / Cn | Average exchange fees associated with fills (Negative = fee; Positive = rebate) |
Auction Details
Note:
In a TCA Report, the client receives two separate Auction Detail tables: one titled "SPX" and one titled "Except SPX".
| Variable/Measure | Definition |
|---|---|
| Single Exposure | Single strike exposure auction detail (Step up to NBBO / fast auction) |
| Single Improve | Single strike price improvement auction detail |
| MLeg Exposure | Multi-leg order exposure auction detail (Step up to NBBO / fast auction) |
| MLeg Improve | Multi-leg order price improvement auction detail |
| Avg. Market Width | Average market width (not relative) |
| Num. of Auc Responses | Total number of auction responses |
| Num. of Child Fills | Number of child orders that resulted in a fill or partial fill |
| Filled Contracts | Average number of filled contracts per day |
| Avg. Resp. Size | Average number of contracts in auction response child orders |
| Order Fill % | Average daily fill rate Filled orders / orders sent |
| Filled Abs Vega | Total absolute filled Vega (100 multiplier applies) |
| Filled Abs Wt Vega | Total absolute filled Vega normalized by volatility and time-to-expiration Cn × iVol × (0.25/years) |
| Surf Edge / Cn | Fill price vs. Surface price If Buy: Surface price - Fill price If Sell: Fill price - Surface price |
| Avg. Fill Prob | Average fill probability per contract |
| Short-Term Dn PnL / Cn | Fill price vs. Surface price T + 10min (delta neutral) |
| Day Dn PnL / Cn | Fill price vs. SpiderRock closing mark (delta neutral; delta at time of fill) |
| Arrival Dn PnL / Cn | Fill price vs. Parent order arrival time mid-mark (delta neutral) |
| Half-Width Cost / Cn | (AskPrice - BidPrice) / 2 |
| Exchange fees / Cn | Average exchange fees associated with fills (Negative = fee; Positive = rebate) |