Volatility Time Calculation
Trading Day Time
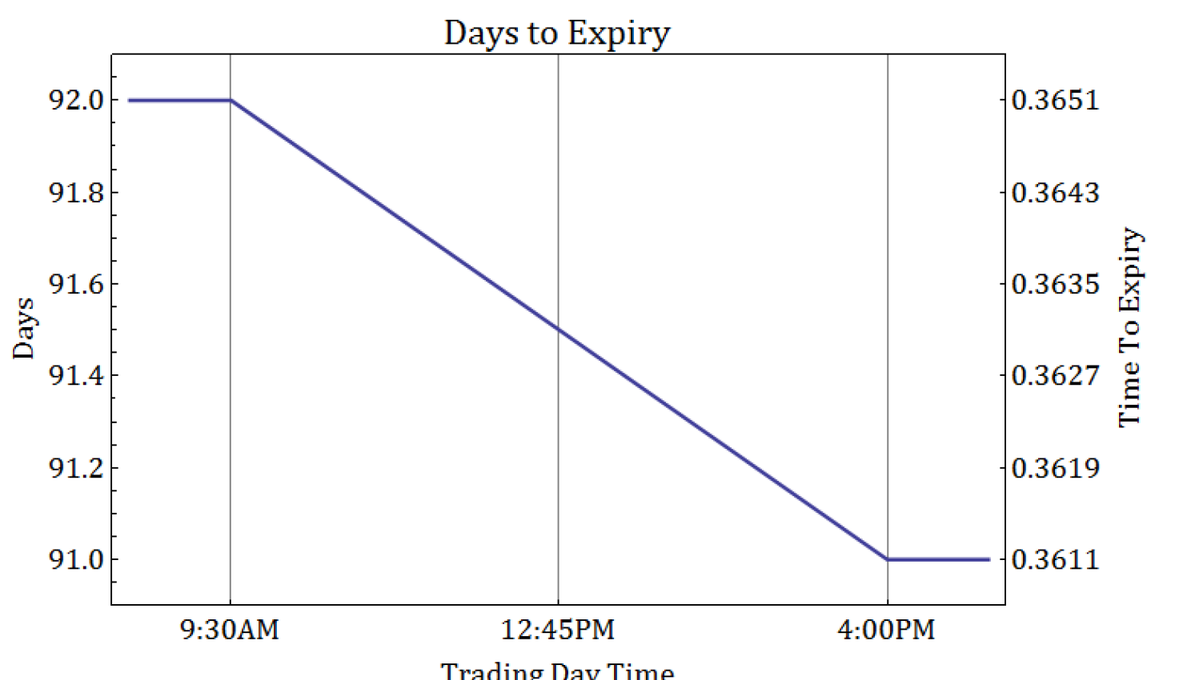
In prior versions of SpiderRock Connect's platform, the calculation for time-to-expiration has followed a business-day count convention (BUS/252) with intraday time decay. As time progressed over a trading session, the time-to-expiration would decay each minute, starting at a full fraction of a day upon market open and decaying to zero by the end of the day. The rule-of-thumb for calculating time was to start with the number of days left to expiration (including the current day), and subtract the fraction of the trading day that had elapsed since the market opened. This fraction was easily calculated by taking the number of trading hours that had occurred since 8:30 AM EST and dividing by the 6.5 hours in a typical US equity market trading day.

However, this approach oversimplifies the relationship between the underlying price movement during the trading session, and after the market is closed. It assumes that no volatility occurs unless the market is open, and it ignores the possibility that a contract might have trading activity outside of these hours.
Volatility Time
In the latest version of SpiderRock Connect's platform, the time decay has been updated to account for volatility that occurs both during and after trading hours. For US equity markets, roughly 70% of the price variance occurs during market trading hours. To better account for this relationship in a business-day count convention, we distinguish between trading hours and non-trading hours throughout an entire trading year.
Consider an option expiring exactly 48 hours from now, after two consecutive days of trading. For the sake of simplicity, if a trading session is 8 hours long, then there will be twice as much time spent when the market is closed as during market hours (i.e. 16 hours off, then 8 hours on). If the forecast volatility used to price the option is 20%, but 70% of the price variance is expected to occur during the two 8-hour trading sessions, then the time decay can be shifted to make the total variance accrue at a constant rate:

- Note that the two plots actually represent the same relationship between time and volatility. The difference comes from a change in perspective, between the actual hours that pass and the time inferred from an assumption of constant variance. In order to make volatility decay at a constant rate, the “volatility time” needs to reflect the fraction of variance which occurs over each period of time. Simply put, if the non-trading hours generate 30% of the variance, then the volatility time for that period should be 0.3 days.
Extending this concept to a business-day count convention for equities, suppose there are 252 trading days, each with 6.5 hours of trading time, representing a total of [252 * 6.5 = 1,638] hours. Under a 252-trading-day year assumption, the total number of hours in a year is [365 * 24 = 8,760] hours, so the remaining non-trading hours in the year amount to [8,760 - 1,638 = 7,122] hours. If expected volatility is the same between market and non-market hours, each hour should count as 1/8,760 of a year.
In this constant volatility framework, the entire year can be broken up into 1638 trading and 7,122 non-trading time segments, each representing an hour, all of which add up to 1:
However, in a business day count convention, where the 7,122 non-trading hours account for none of the variance, the time unit used for a single trading hour needs to be adjusted so that the time measured during each trading session accounts for all of the time accumulated in the year. This is accomplished by counting all non-trading hours as equal to zero and counting each trading hour as 1/1,638 of a year:
- Note: When volatility time uses 1/1,638 for each trading hour, the time elapsed during open market hours is 6.5/1,638 years, which is equal to 1/252.
The generalization is fairly straightforward. If you want trading time to account for 70% of the variance, then the first term in the equation (i.e. total trading hour time) needs to be 0.7, and the second term needs to be 0.3:
Any weight can be used to determine the volatility time for a trading hour and for a non-trading hour, by taking a weighted average where α is the percent of volatility attributed to trading time:
With this approach, we account for time in terms of fractions of hours during trading and fractions of hours outside of trading, each multiplied by their respective volatility “times” for a trading market hour and a non-trading market hour.
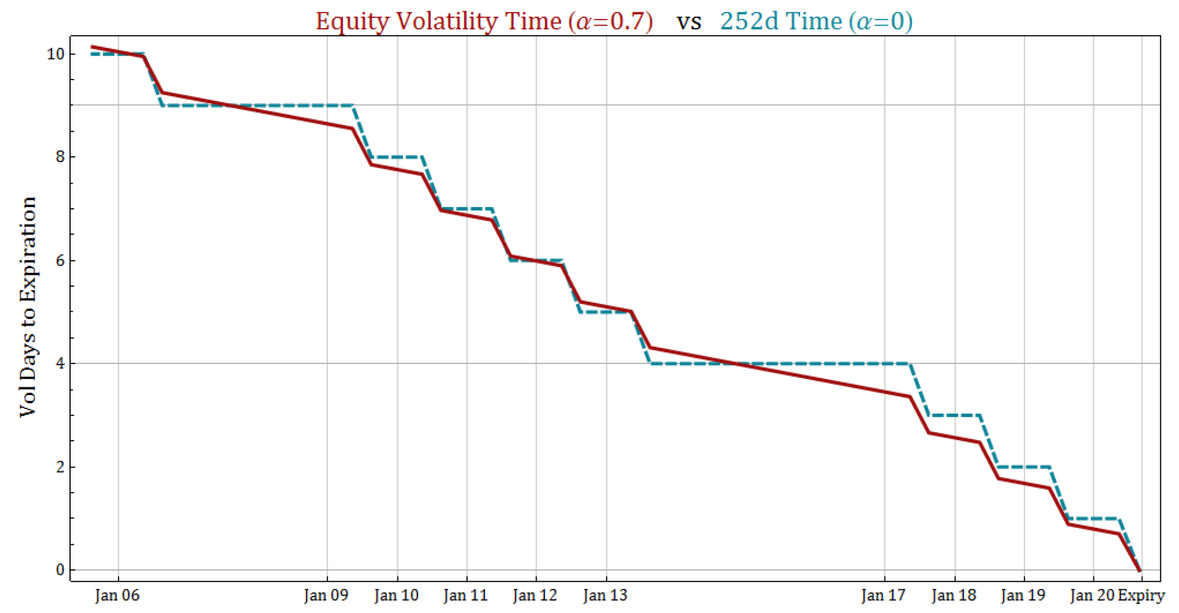
To give an idea of how a 70%-trading-time volatility convention (α=0.7) compares against the original 252-day convention in previous versions of SpiderRock Connect (α=0.0), the following plot shows both approaches applied to the last two weeks leading up to the 20 January 2017 expiration. For ease of comparison, the time has been converted into volatility “days” by multiplying time by 252.

Trading Day Time
In prior versions of SpiderRock Connect's platform, the calculation for time-to-expiration has followed a business-day count convention (BUS/252) with intraday time decay. As time progressed over a trading session, the time-to-expiration would decay each minute, starting at a full fraction of a day upon market open and decaying to zero by the end of the day. The rule-of-thumb for calculating time was to start with the number of days left to expiration (including the current day), and subtract the fraction of the trading day that had elapsed since the market opened. This fraction was easily calculated by taking the number of trading hours that had occurred since 8:30 AM EST and dividing by the 6.5 hours in a typical US equity market trading day.
However, this approach oversimplifies the relationship between the underlying price movement during the trading session, and after the market is closed. It assumes that no volatility occurs unless the market is open, and it ignores the possibility that a contract might have trading activity outside of these hours.
Volatility Time
In the latest version of SpiderRock Connect, the time decay has been updated to account for volatility that occurs both during and after trading hours. For US equity markets, roughly 70% of the price variance occurs during market trading hours. To better account for this relationship in a business-day count convention, we distinguish between trading hours and non-trading hours throughout an entire trading year.
Consider an option expiring exactly 48 hours from now, after two consecutive days of trading. For the sake of simplicity, if a trading session is 8 hours long, then there will be twice as much time spent when the market is closed as during market hours (i.e. 16 hours off, then 8 hours on). If the forecast volatility used to price the option is 20%, but 70% of the price variance is expected to occur during the two 8-hour trading sessions, then the time decay can be shifted to make the total variance accrue at a constant rate:
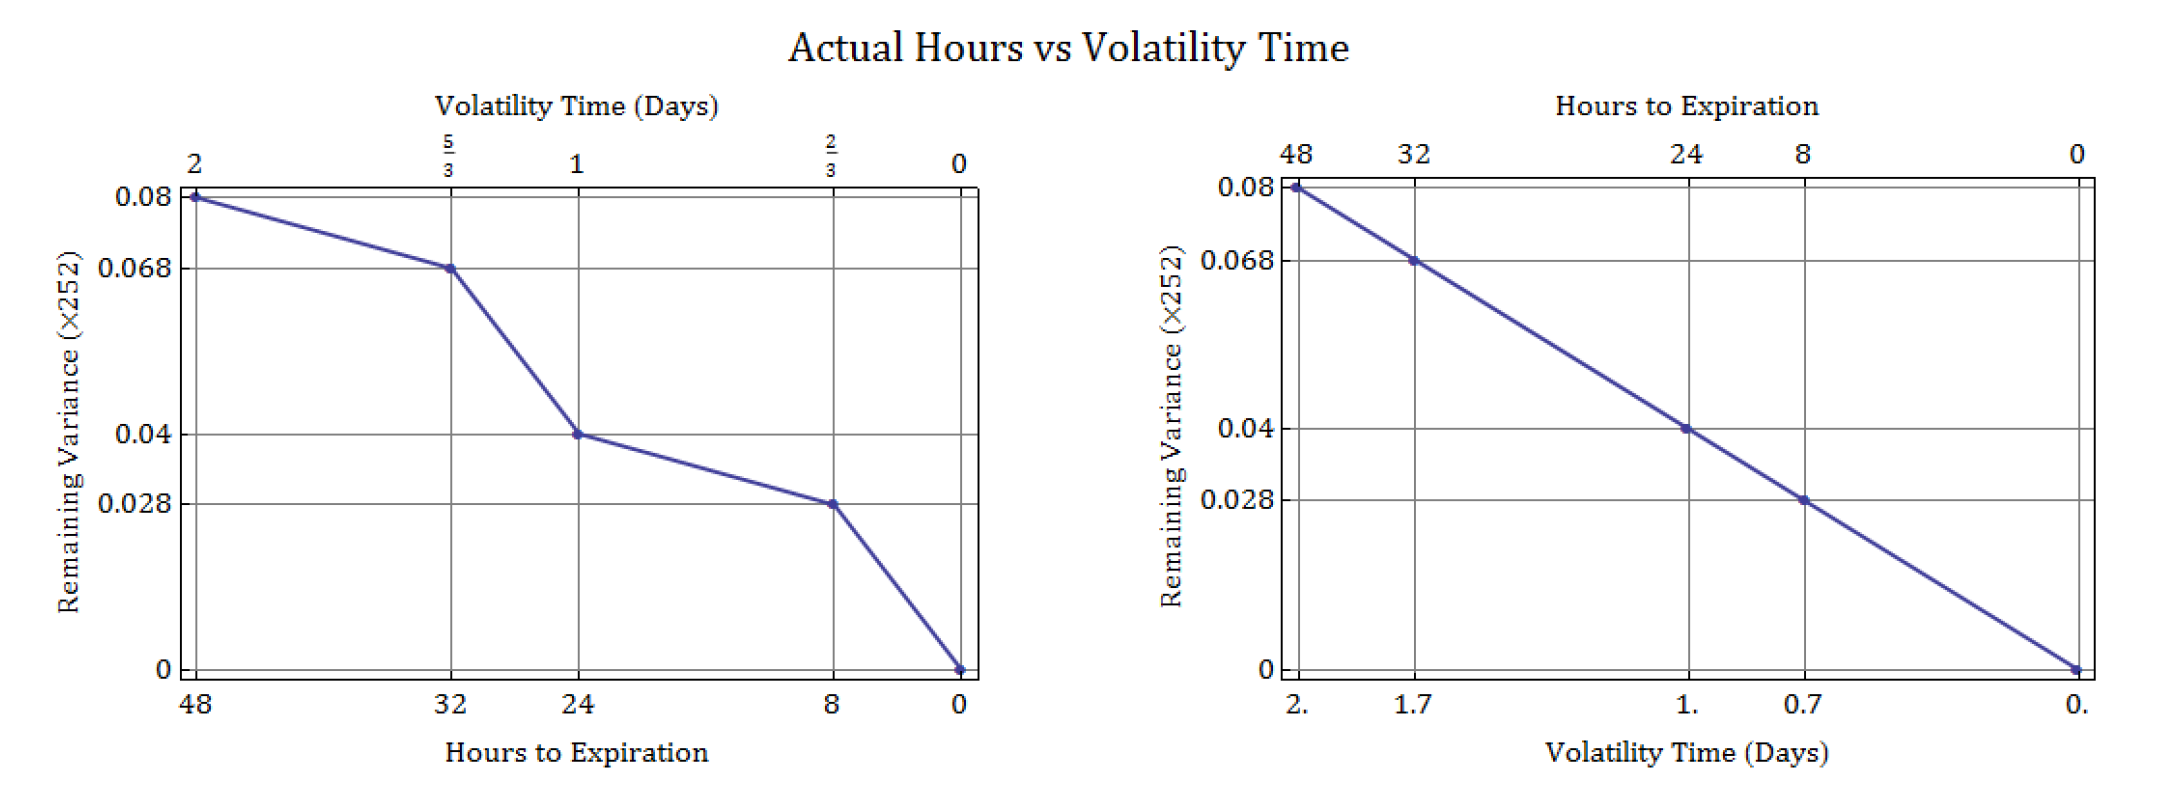
- Note that the two plots actually represent the same relationship between time and volatility. The difference comes from a change in perspective, between the actual hours that pass and the time inferred from an assumption of constant variance. In order to make volatility decay at a constant rate, the “volatility time” needs to reflect the fraction of variance which occurs over each period of time. Simply put, if the non-trading hours generate 30% of the variance, then the volatility time for that period should be 0.3 days.
Extending this concept to a business-day count convention for equities, suppose there are 252 trading days, each with 6.5 hours of trading time, representing a total of [252 * 6.5 = 1,638] hours. Under a 252-trading-day year assumption, the total number of hours in a year is [365 * 24 = 8,760] hours, so the remaining non-trading hours in the year amount to [8,760 - 1,638 = 7,122] hours. If expected volatility is the same between market and non-market hours, each hour should count as 1/8,760 of a year.
In this constant volatility framework, the entire year can be broken up into 1,638 trading and 7,122 non-trading time segments, each representing an hour, all of which add up to 1:
However, in a business day count convention, where the 7,122 non-trading hours account for none of the variance, the time unit used for a single trading hour needs to be adjusted so that the time measured during each trading session accounts for all of the time accumulated in the year. This is accomplished by counting all non-trading hours as equal to zero and counting each trading hour as 1/1,638 of a year:
- Note: When volatility time uses 1/1,638 for each trading hour, the time elapsed during open market hours is 6.5/1,638 years, which is equal to 1/252.
The generalization is fairly straightforward. If you want trading time to account for 70% of the variance, then the first term in the equation (i.e. total trading hour time) needs to be 0.7, and the second term needs to be 0.3:
Any weight can be used to determine the volatility time for a trading hour and for a non-trading hour, by taking a weighted average where α is the percent of volatility attributed to trading time:
With this approach, we account for time in terms of fractions of hours during trading and fractions of hours outside of trading, each multiplied by their respective volatility “times” for a trading market hour and a non-trading market hour.
To give an idea of how a 70%-trading-time volatility convention (α=0.7) compares against the original 252-day convention in previous versions of SpiderRock Connect (α=0.0), the following plot shows both approaches applied to the last two weeks leading up to the 20 January 2017 expiration. For ease of comparison, the time has been converted into volatility “days” by multiplying time by 252.